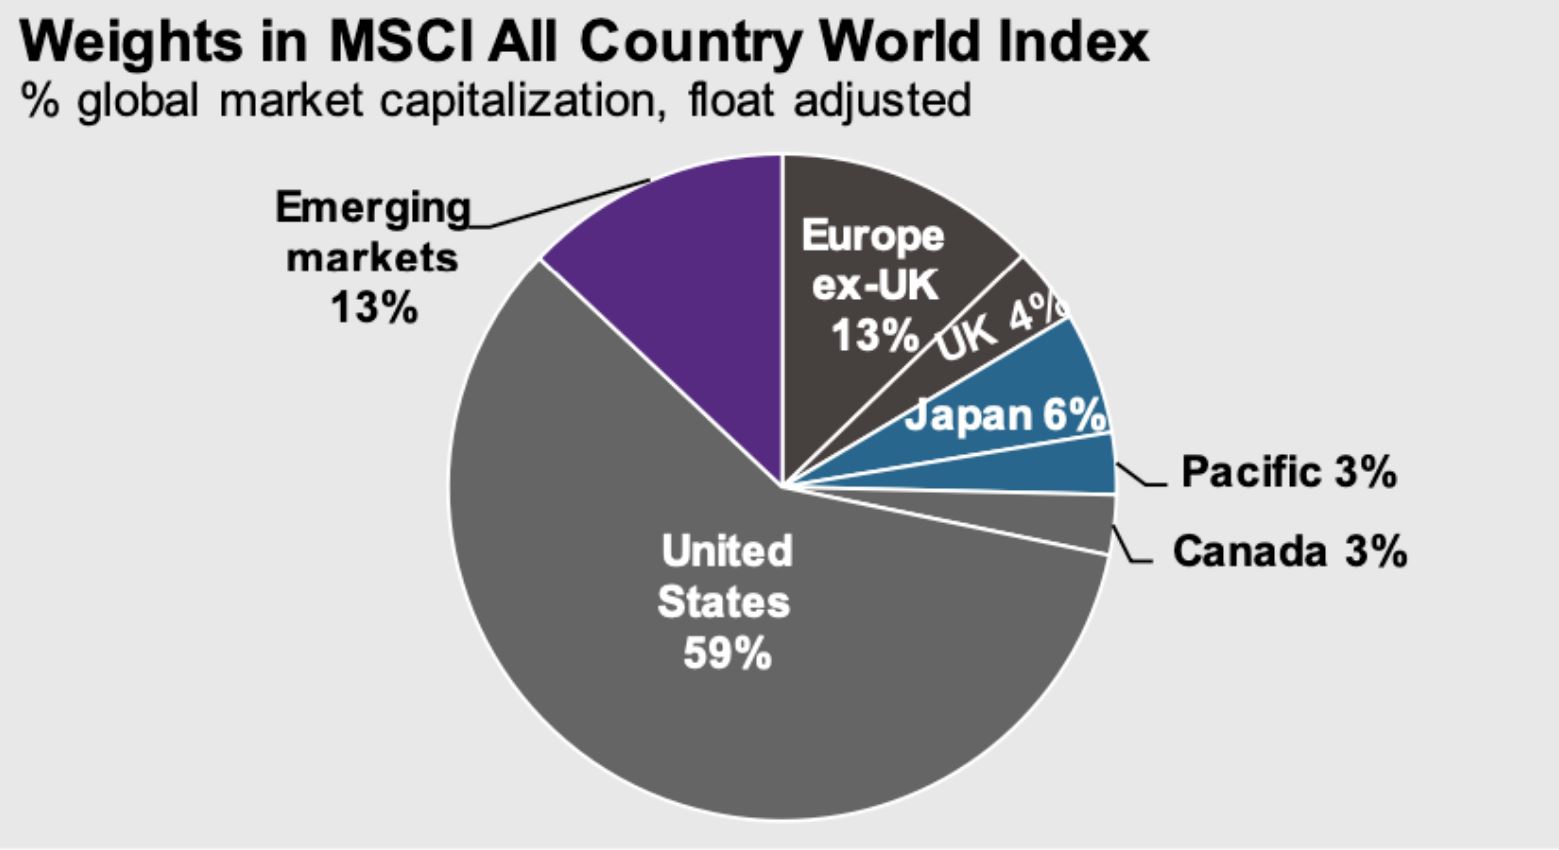
US equities continue to have by far the dominant share of global market capitalization
Leave a reply

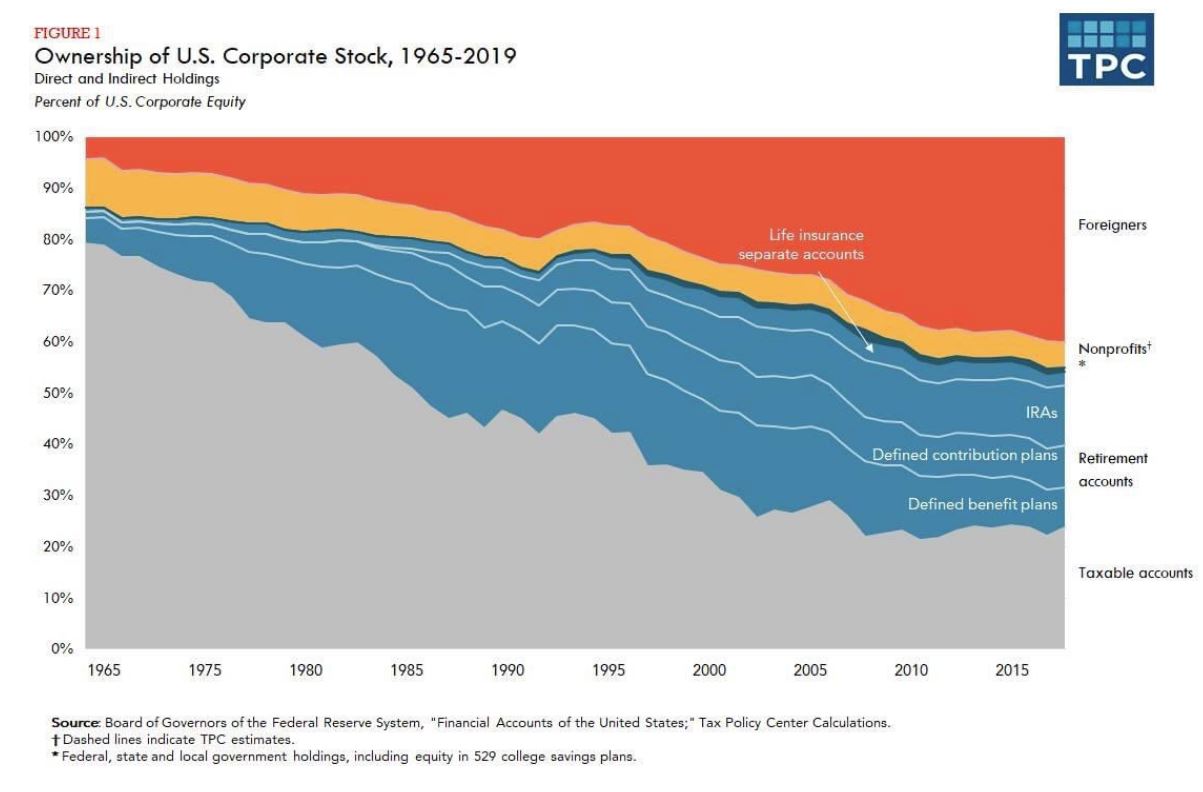
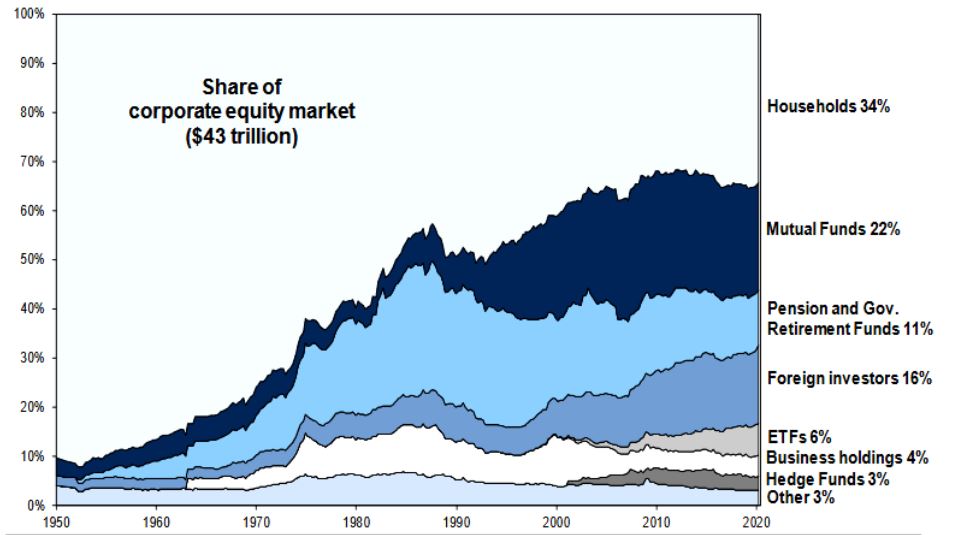
The latest estimates of the ownership breakdown of US equities are out and two points spring to mind. Firstly, that households represent the largest segment; and secondly, that foreign investors represent the largest institutional segment.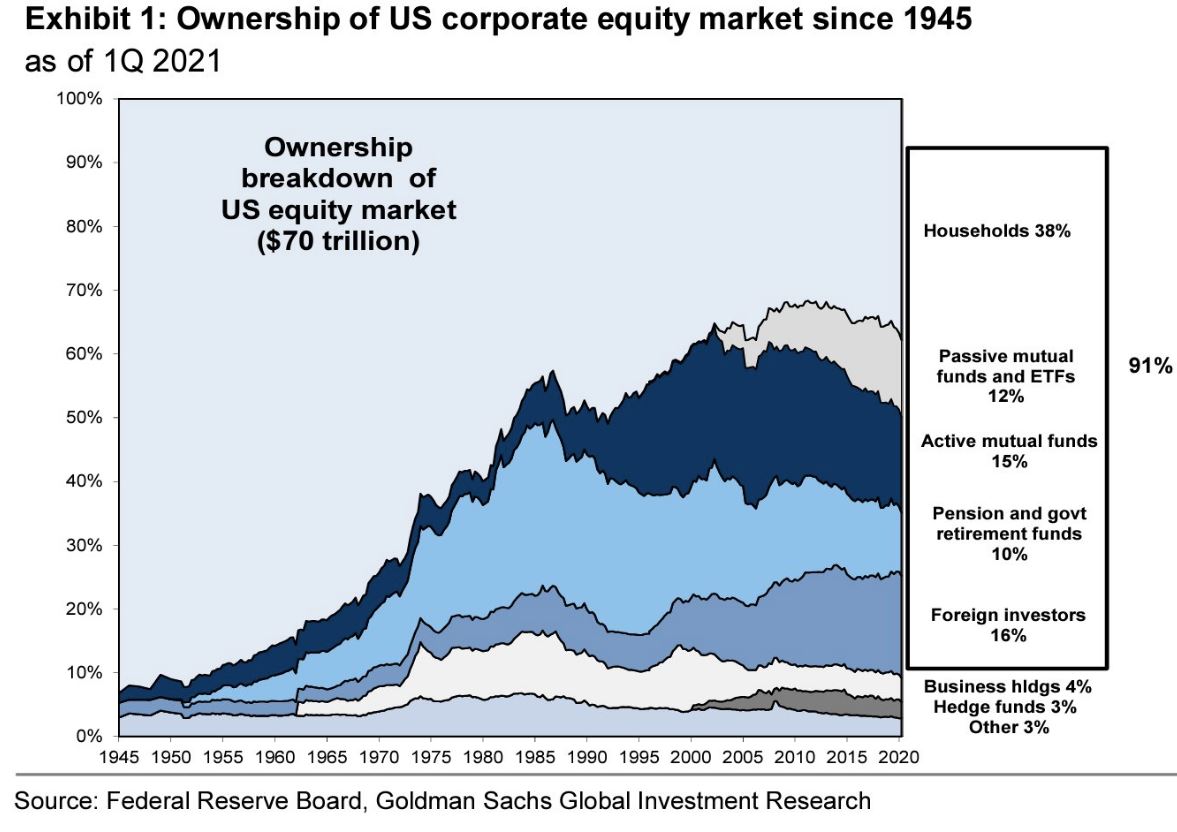
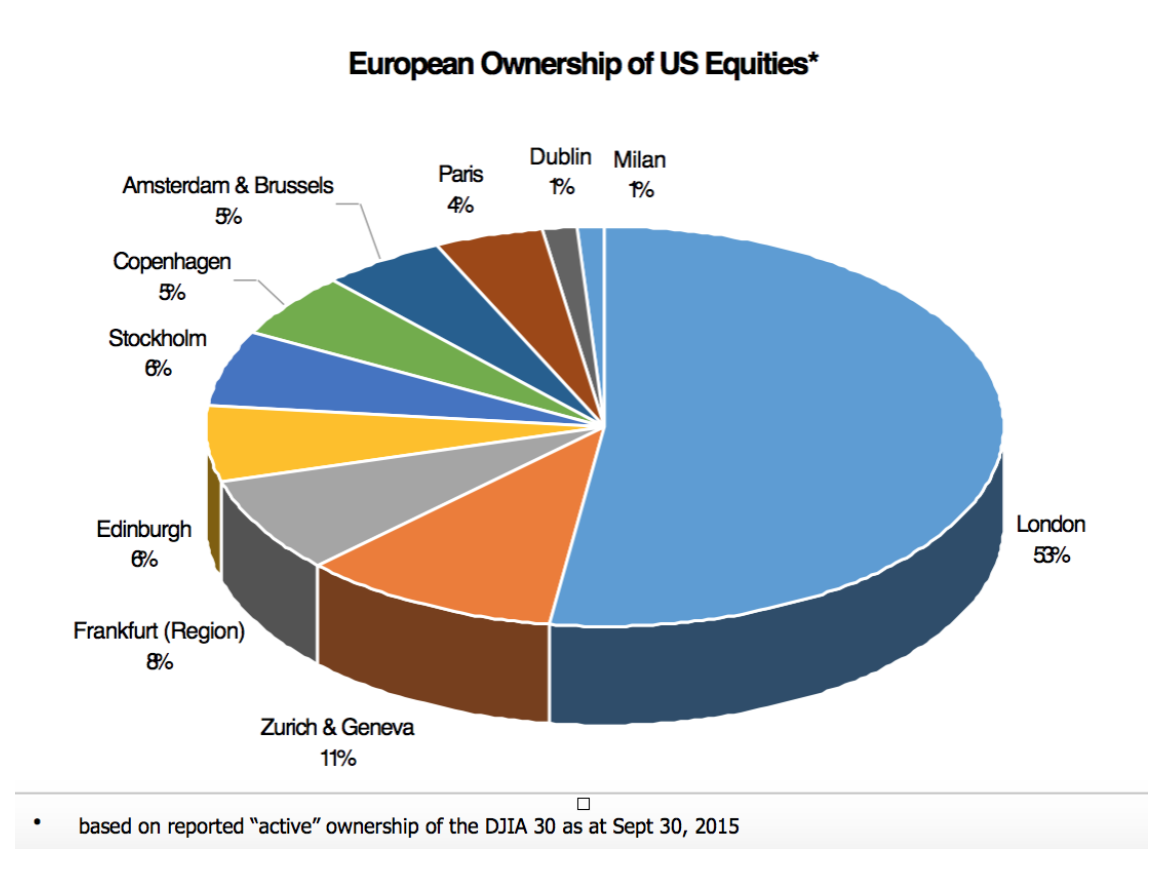
Any U.S. companies wondering whether they should communicate with international investors should consider this chart…..
Overseas investors, who own 16% of the U.S. corporate equity market, bought $187 billion of shares during the three months through March, making them the biggest buyers of U.S. stocks during the first quarter of the year. Net corporate holdings increased by $129 billion and household purchases, including hedge funds, rose by $7 billion while pension funds and mutual funds sold a net $119 billion and $66 billion, respectively.
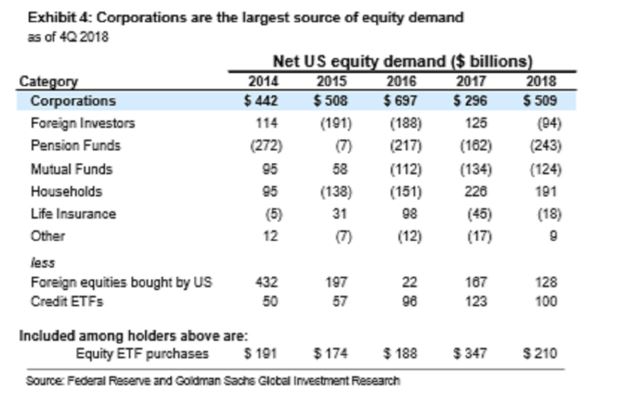
“Foreign investors will continue to be net buyers of U.S. stocks this year and will replace corporations as the largest source of equity demand (+$300 billion),” according to Goldman Sachs’ Portfolio Strategy Research team led by David Kostin. Goldman Sachs predicts net corporate equity demand will drop by 80% in 2020 to $100 billion as buybacks are suspended.
Source: Federal Reserve Board and Goldman Sachs Global Investment Research
“The EFAMA Asset Management in Europe report aims at providing facts and figures to gain a better understanding of the role of the European asset management industry. It takes a different approach from that of the other EFAMA research reports, on two grounds. Firstly, this report does not focus exclusively on investment funds, but it also analyses the assets that are managed by asset managers under the form of discretionary mandates. Secondly, the report focuses on the countries where the investment fund assets are managed rather than on the countries in which the funds are domiciled.
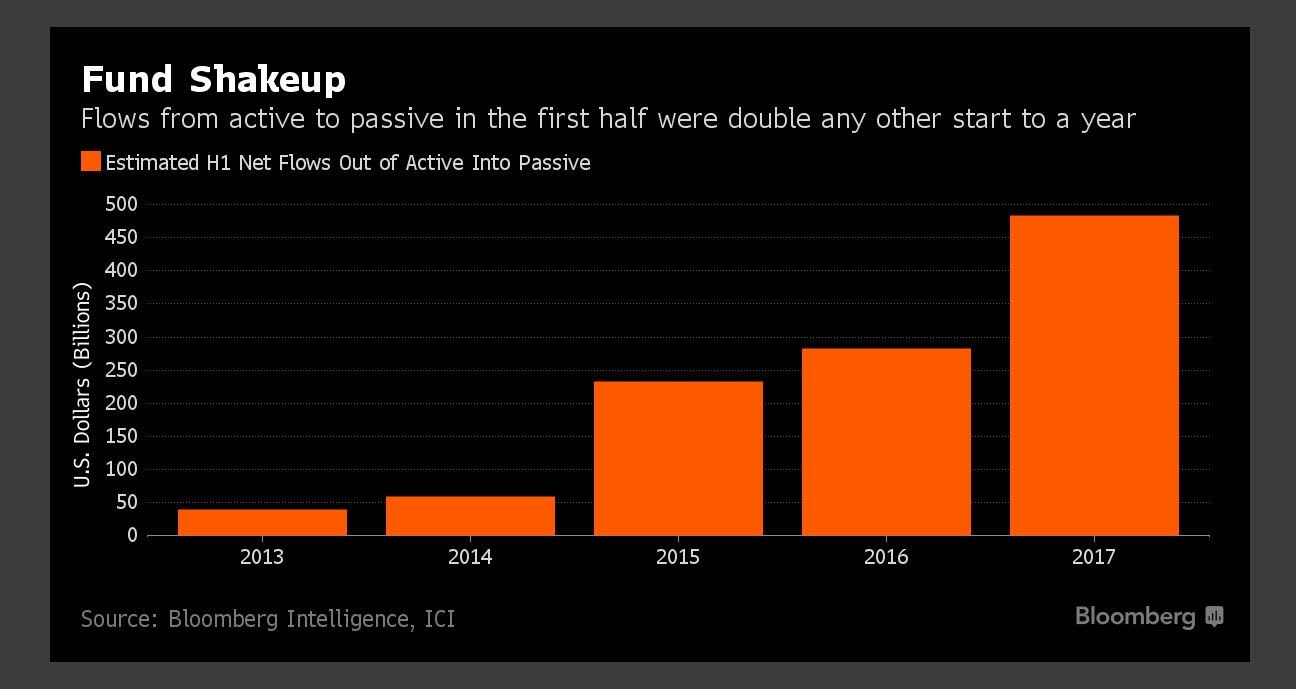
An interesting recent report from Goldman Sachs shows that share buybacks have been the largest source of U.S. equity demand during the last five years. Apparently, since 2010, net corporate buybacks averaged $420 billion annually, compared to only $10 billion each from households, mutual funds, pension funds and foreign investors.
According to a Bloomberg report, Goldman studied stock performance during earnings blackout periods, when discretionary buybacks are restricted beginning about five weeks before a company releases earnings, and then for two days afterwards. During the past 25 years, return dispersion and volatility during blackout windows have been higher compared with non-blackout periods: 16 percentage points versus 14 percentage points, and 16.4 points versus 15.8 points, respectively. Meanwhile, since buybacks have bolstered earnings per share by reducing the total stock outstanding, blocking repurchases would hurt growth in EPS. Over the past 15 years, the gap between EPS growth and earnings growth for the median S&P 500 company averaged 260 basis points. According to Goldman Sachs “In a world without buybacks, forward EPS growth could be trimmed by 250 bp,” a reduction that has historically corresponded to a 1 point decline in forward price-earnings multiples.
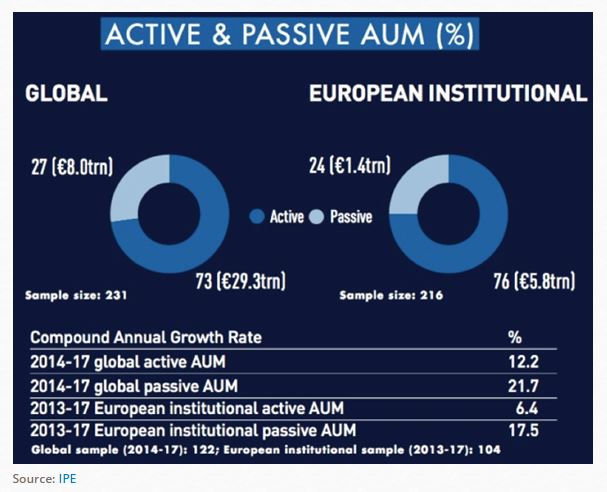
Source: https://www.ipe.com/news/asset-managers/top-400-asset-managers-2017-global-passive-assets-hit-8trn/10019389.article
Goldman Sachs has made some interesting observations about the relative sizes of U.S. companies compared to Europeans.
Here are some light hearted comparisons (based on total market capitalisation data)
A US equity map of Europe – US companies shown in each country equate to the size of total market capitalization in the country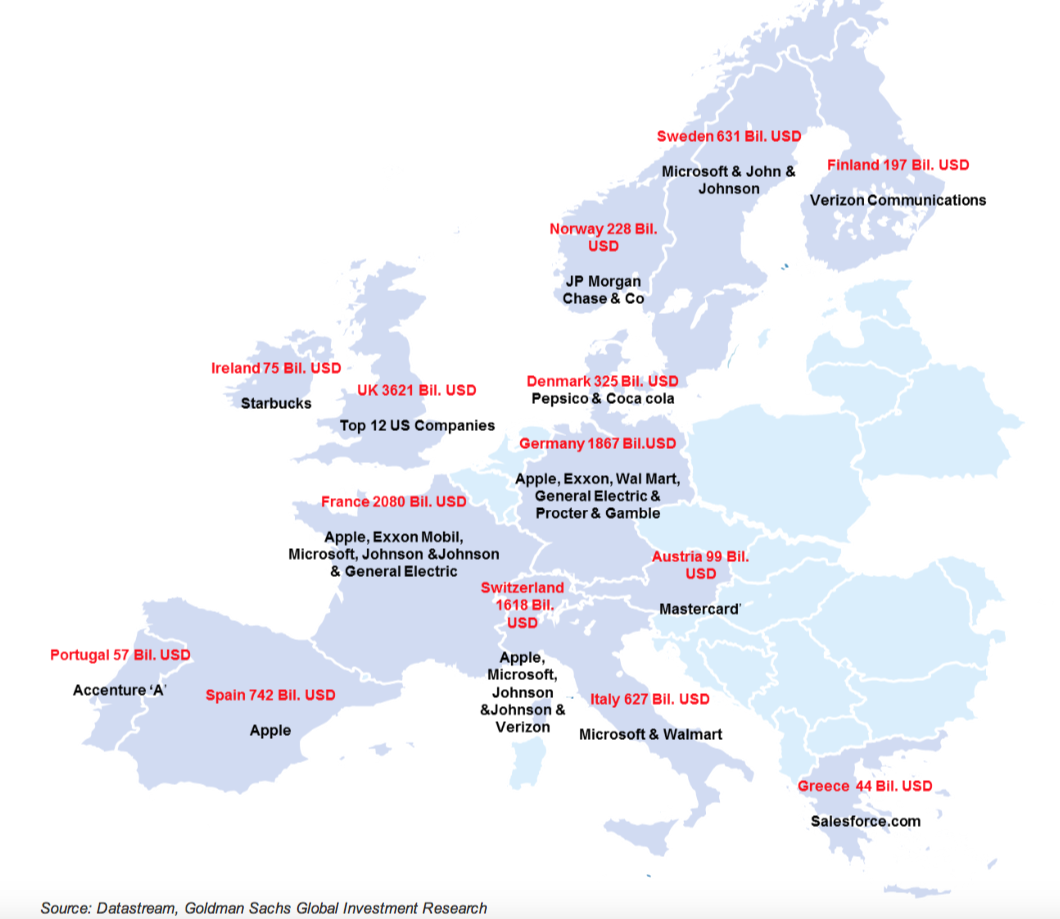 Europe’s 600 biggest companies (the Stoxx600) are less than half the size of the S&P 500.
It’s also interesting that even in the context of Europe the Swiss market alone is bigger than Spain and the Netherlands combined. The UK 100 biggest companies (FTSE 100) are bigger than the CAC and Dax put together.