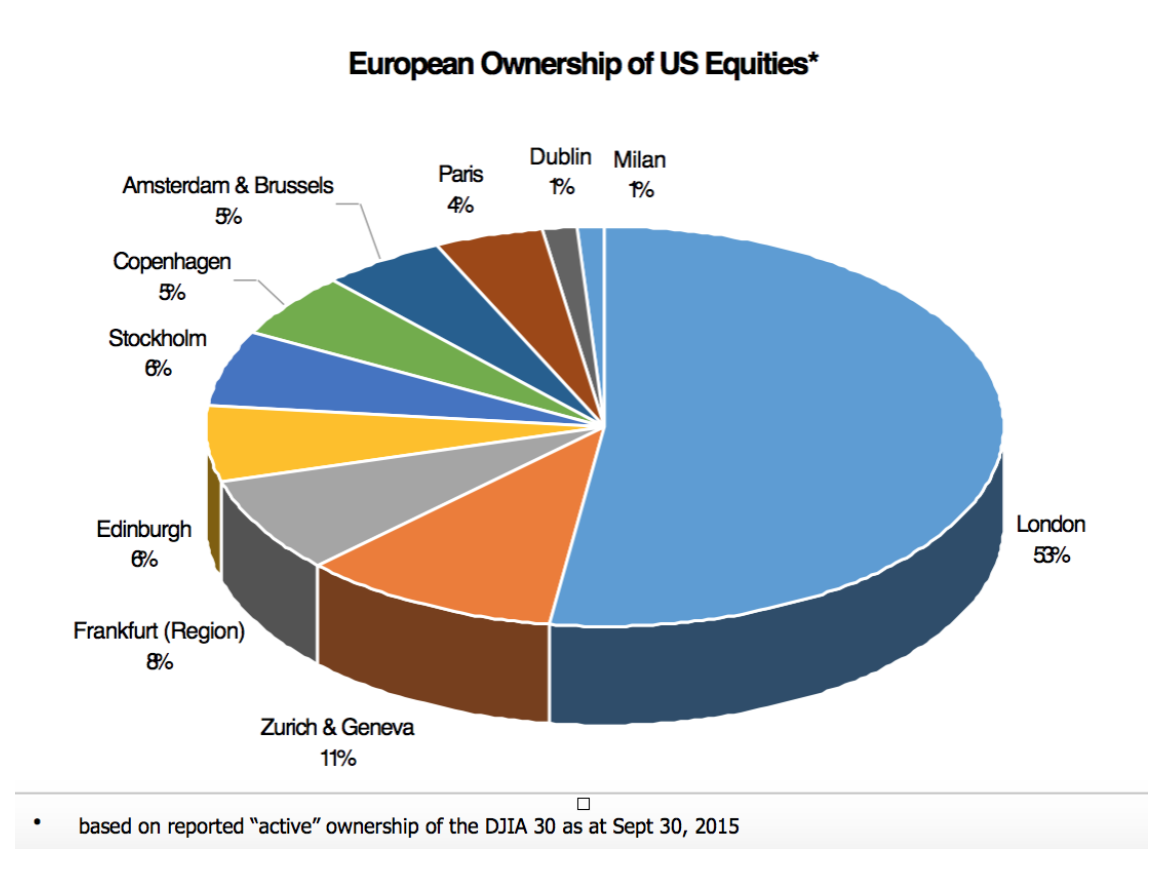
European Ownership of US Equities
Leave a reply

Goldman Sachs has made some interesting observations about the relative sizes of U.S. companies compared to Europeans.
Here are some light hearted comparisons (based on total market capitalisation data)
A US equity map of Europe – US companies shown in each country equate to the size of total market capitalization in the country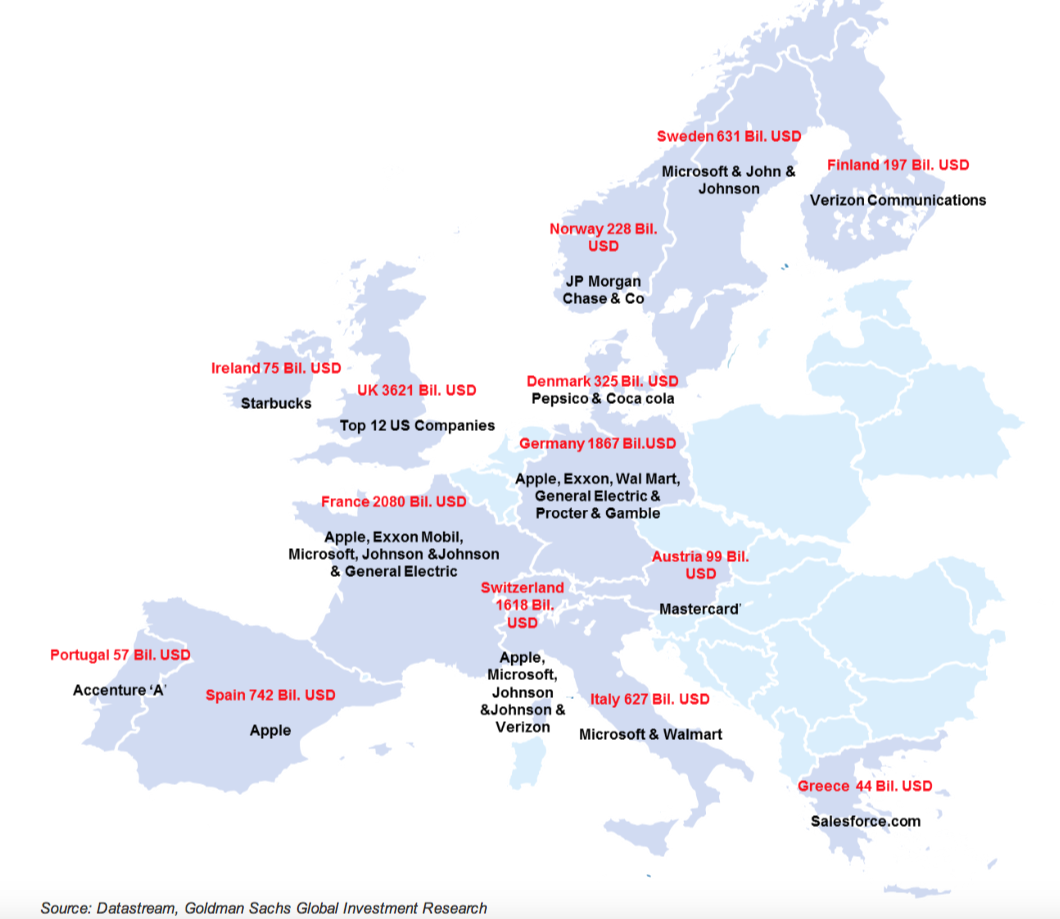 Europe’s 600 biggest companies (the Stoxx600) are less than half the size of the S&P 500.
It’s also interesting that even in the context of Europe the Swiss market alone is bigger than Spain and the Netherlands combined. The UK 100 biggest companies (FTSE 100) are bigger than the CAC and Dax put together.

* Public data ex U.S. is incomplete because of poor disclosure, therefore underestimating foreign ownership
Swiss Private Banking has assets under management of SFr 5.3 trillion ($5.5 tn), half of which is on behalf of off-shore customers.