IROs are constantly asking us about interacting with SWFs (Sovereign Wealth Funds) but they also have many reservations, mainly due to the limited disclosure and poor transparency of some entities. In our role as IR consultants we frequently advise IROs on specific SWFs and facilitate access to key decision makers. In this update we’ve pulled together some recent data which we believe is interesting and worth sharing with you. If you would like to know more, please don’t hesitate to contact us directly.
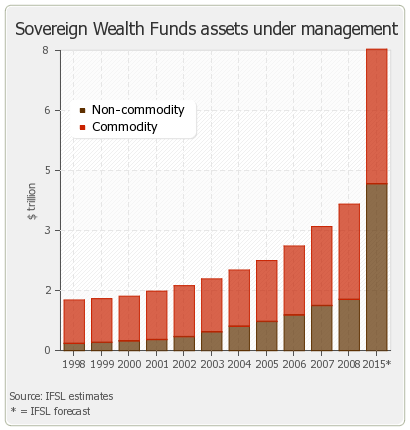
- IFSL estimates that AUM of SWFs increased by 18% in 2008 to $3.9 trillion. Huge losses on some investments were more than offset by inflows. IFSL projections are that SWFs are likely to double from their current level to around $8 trillion in 2015.
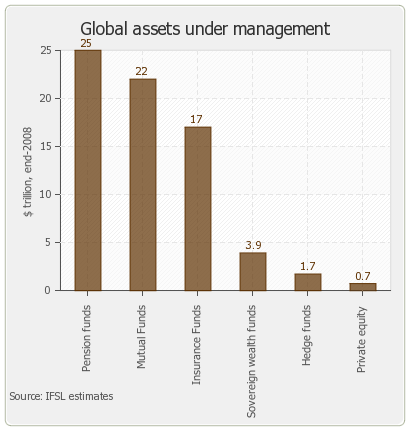
- SWFs are already significantly bigger than hedge funds.
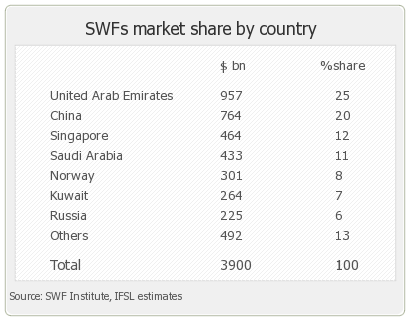
- Around 45% of SWFs come from oil rich countries in the Middle East.
- Pensions & Investments magazine estimates approx 45% of SWF assets are managed by external managers. This may decline as more SWFs develop internal capabilities and shift from passive to active strategies.
- Deutsche Bank estimates changing asset allocation could lead to an inflow of more than $1 trillion into global equity markets and $1.5 trillion into debt markets between 2008 and 2013.
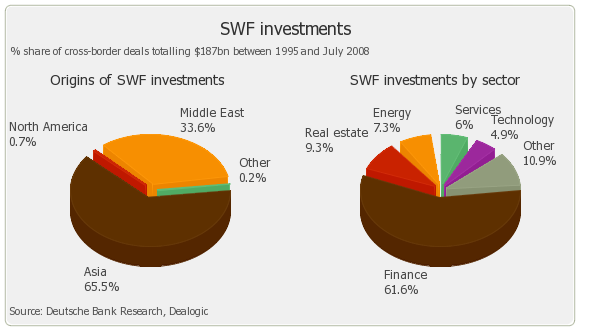
- Around 80% of oil exporting SWFs are invested in overseas assets with 50% of these investments in equities, 25% in fixed income and 15% in cash. The US is the destination for more than half of these investments with around 20% destined for Europe. More recently some SWFs have been emphasizing investments in their domestic markets and Asia.